V85 Model LabCan a model beat the crowd at Swedish trotting?
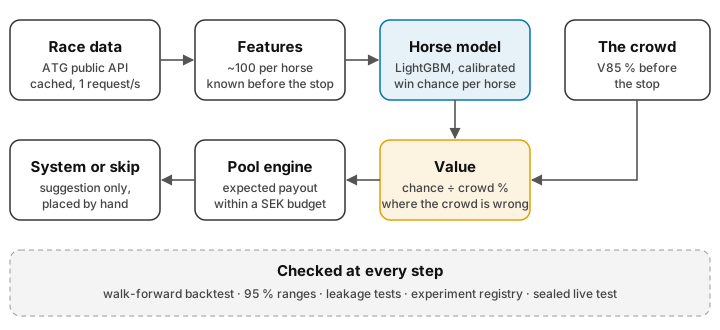
I built a system that estimates every horse's chance of winning in ATG's V85, compares it with how the crowd bets, and looks for the races where the crowd is wrong. It is tested like a trading model, with no peeking at the future and an uncertainty range on every number.
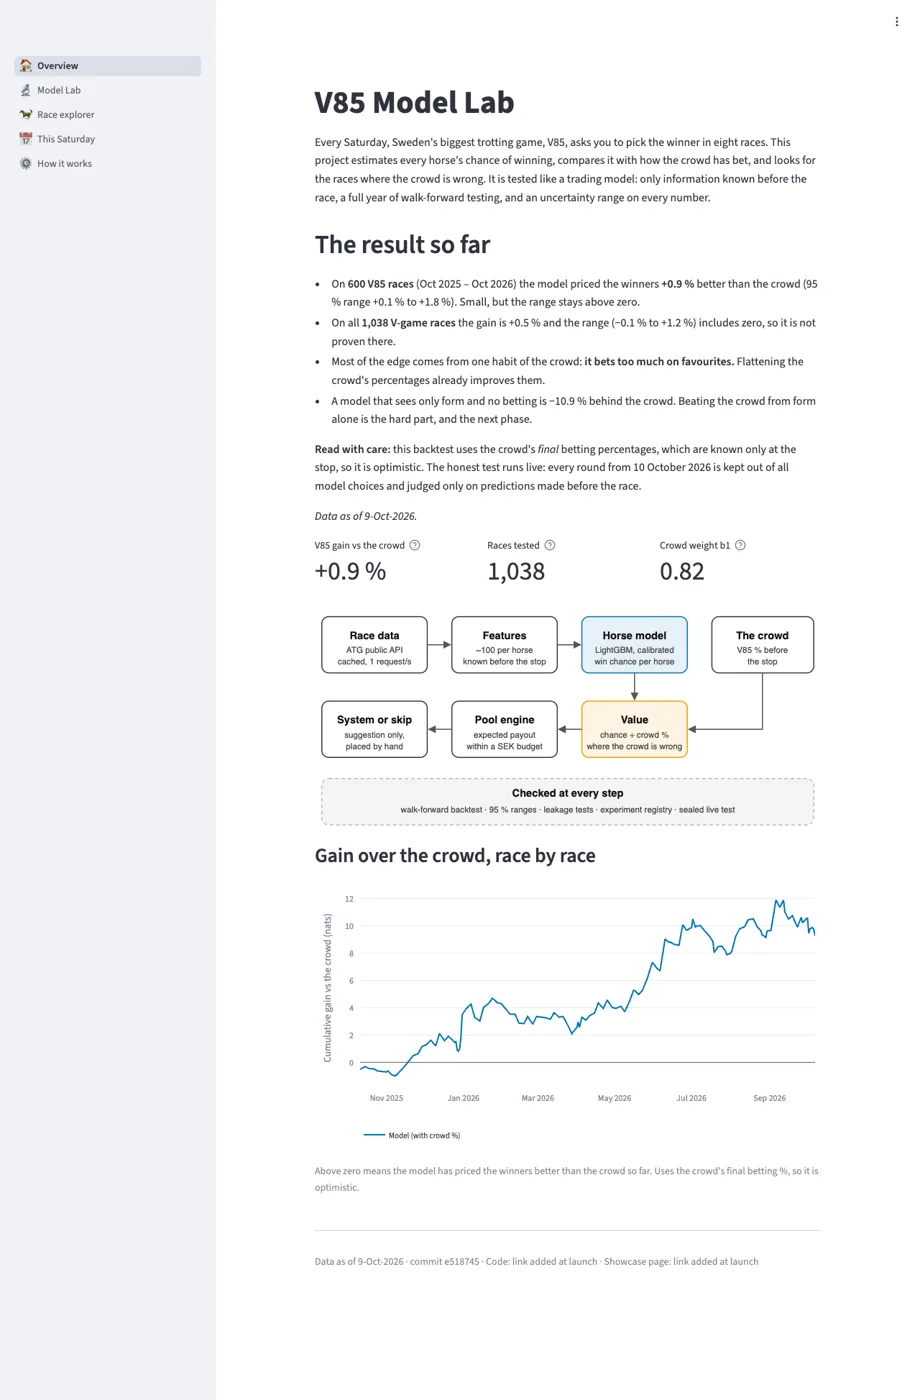
1,038races tested, walk-forward over Oct 2025 – Oct 2026
+0.9 %better than the crowd at pricing V85 winners (95 % range +0.1 % to +1.8 %)
0.82the crowd's weight on its own favourites: below 1 means it overbets them
What I found
The crowd is hard to beat. A model that sees only form trails the crowd's betting percentages: its gain is −10.9 %.
But it has a habit. It bets too much on favourites. Correcting that gives a small, measurable edge on V85.
The backtest is optimistic, because it uses the final betting percentages. So every round from 10 October 2026 is a sealed live test, and from November each prediction is published as a hash before the race.
Gain against the crowd, added up race by race over the year. A line that keeps rising is a real edge; a random walk is luck.Calibration: when the model says 20 %, does the horse win about 20 % of the time?Model against the crowd, model by model, with 95 % ranges. Left off to keep the scale readable: Pure chance (−0.64).